Foundations of Data Engineering : The Data Journey – From Raw Data to Usable Insights
The Data Engineering Lifecycle: Transforming Rawness into Relevance
Welcome back to our Foundations of Data Engineering series. If you joined us for the first installment—"What is Data Engineering? A Non-Buzzword Guide"—you already know that data engineering isn’t just about big tools and bigger hype. It’s about building systems that make data useful, reliable, and ready for real-world applications.
In this second edition, we're rolling up our sleeves and diving into what I like to call “the data journey”—a behind-the-scenes look at how raw, messy, and often chaotic data is transformed into clean, structured, and valuable insights. Whether you're working on a personal project, contributing to a startup, or preparing for a professional certification, understanding this end-to-end pipeline is non-negotiable.
So, why does this journey matter? Imagine trying to build a house without a blueprint, without clean materials, and without a plan to make it livable. That’s exactly what happens when organizations skip stages in the data lifecycle. Each step—from ingestion to analytics—adds value and integrity, making the data more trustworthy and actionable.
Over the next few minutes, we’ll walk through every stage of the modern data engineering pipeline: how we ingest data from diverse sources, where and how we store it, how it’s processed and validated, and how we finally deliver it for analysis, visualization, and decision-making. Along the way, I’ll also sprinkle in some tools, real-world use cases, and best practices to keep things grounded and applicable.
Whether you're a student curious about how real systems are built or a budding engineer preparing for that next big role, this is your roadmap.
Ready to follow the data from its raw beginnings to insightful glory?
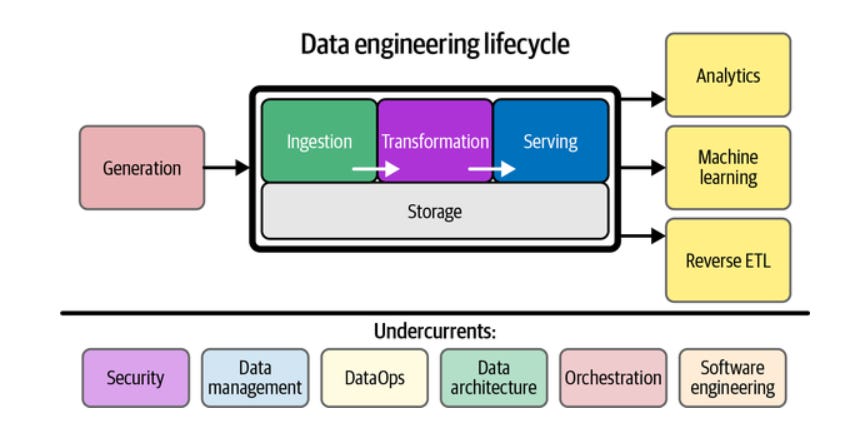
Let’s get started—with Data Ingestion, the gateway to the entire journey.
1. Data Ingestion: Where the Journey Begins
Alright, picture this: you’re sitting at your laptop, coffee in hand, staring at a dashboard that says, “Sales are down 7% this week.” Ever wonder how that number got there? It all starts with data ingestion—the act of pulling raw data in from the outside world and feeding it into your data ecosystem.
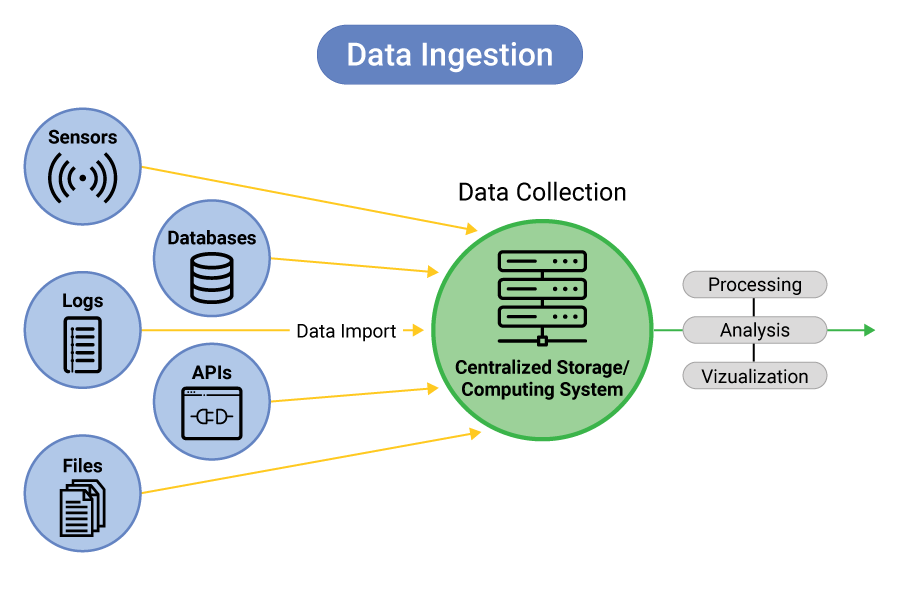
Think of ingestion as the front door to your data pipeline. Everything that follows—cleaning, processing, analysis—relies on the quality and completeness of what you bring in at this stage.
Now, here’s the fun part. Data doesn’t just show up in one nice tidy format. It comes from everywhere:
Relational databases like MySQL or PostgreSQL (hello, legacy systems).
APIs pumping in real-time updates from web apps or IoT devices.
Flat files like CSVs or JSONs that someone exported from a tool yesterday.
Streaming platforms like Kafka or Kinesis that don’t stop for anyone.
Depending on the use case, ingestion happens in one of two flavors:
Batch ingestion is like checking your email every morning—you collect data at scheduled intervals. Great for nightly reports, not so great if you're tracking fraud in real time.
Streaming ingestion is more like a live news feed. You get updates as they happen, which is crucial for things like stock trading platforms or sensor networks.
Of course, it’s not just about getting the data. You need to bring it in reliably, securely, and often with minimal latency. If your ingestion layer hiccups, everything downstream suffers. Tools like Apache NiFi, AWS Kinesis Data Firehose, or Fivetran help automate and manage these flows, making sure your raw data lands safely in a centralized repository.
Pro tip? Good data ingestion systems are designed with fault tolerance, retry mechanisms, and schema evolution in mind—because in the real world, things break, formats change, and APIs go down.
And that’s your first stop: capturing the chaos. Once we’ve pulled the data in, it’s time to decide where to keep it—and how to make it available for downstream magic.
Up next: Data Storage—our data's new home.
2. Data Storage: Giving Raw Data a Home
Now that we’ve ingested all this glorious raw data—messy, diverse, and flowing in from every corner—it’s time to figure out where to put it. Because let’s face it: data without a proper home is like groceries without a fridge. Sooner or later, things spoil.
This is where data storage comes in. It's not just about saving files; it’s about choosing the right kind of storage for the right kind of data, and making sure it’s easily retrievable, scalable, and cost-efficient.

Let’s break it down with a little analogy: imagine your storage strategy like a library.
Data Lakes are like giant unorganized bookstores—you can dump anything in: structured tables, unstructured PDFs, images, logs, you name it. Think Amazon S3, Azure Data Lake, or Google Cloud Storage. They're great for exploration and scale, but be warned: without structure and governance, you’re heading straight for a “data swamp.”
Data Warehouses are the tightly catalogued, well-lit reading rooms. They’re optimized for analytical queries on structured data—fast, consistent, and ideal for reporting dashboards. Tools like Snowflake, BigQuery, or Amazon Redshift rule this space.
Data Lakehouses? They’re the hybrid co-working space. You get the flexibility of a data lake (store anything!) with the performance of a data warehouse (query efficiently!). Solutions like Databricks Lakehouse or Delta Lake are leading this middle path.
Here’s what matters when choosing a storage layer:
Access Patterns: Are your analysts writing complex SQL joins? Go with a warehouse. Are your data scientists feeding raw logs into ML models? You’ll want a data lake.
Cost and Scale: Object storage like S3 is dirt cheap and infinite. Warehouses charge for compute and storage—super fast, but not always budget-friendly at scale.
Query Latency: Cold storage is slow but cheap; hot storage is expensive but fast. You need to balance both based on use case.
Also, never forget data partitioning and file formats. Using Parquet or ORC can significantly reduce I/O, and partitioning by time, user, or region can accelerate query performance immensely.
So in essence, this step is about deciding how your data lives: structured or unstructured, cold or hot, long-term archive or high-speed analysis layer. Choose wisely—because bad storage design can bottleneck everything else.
Next stop on the data journey: turning that stored data into something usable. Let’s dive into Data Processing.
3. Data Processing: Making Sense of the Chaos
Alright, picture this: you’ve got tons of data coming in—some of it pristine and structured, some of it… well, let’s just say it looks like it had a rough journey. Before we can extract any kind of meaning or insight, we need to clean, shape, and refine it. That’s where data processing enters the scene.
Think of data processing as the data spa. You’re taking in tired, messy data and sending it out refreshed, consistent, and ready to shine.
Cleaning: First, we scrub away the mess—missing values, duplicates, inconsistent formats (like “New York” vs “NYC”), and typos. It’s tedious, yes, but critical. Clean data is trustworthy data.
Transformation: Next, we reshape it—maybe aggregating transactions per user, converting timestamps into a common format, or pivoting wide tables into long ones. This step is all about structuring the raw materials for analysis.
Enrichment: Finally, we enhance it—maybe by adding demographic info from a third-party API, geocoding an address, or calculating derived features. This gives your data context, which is key for deeper insights.
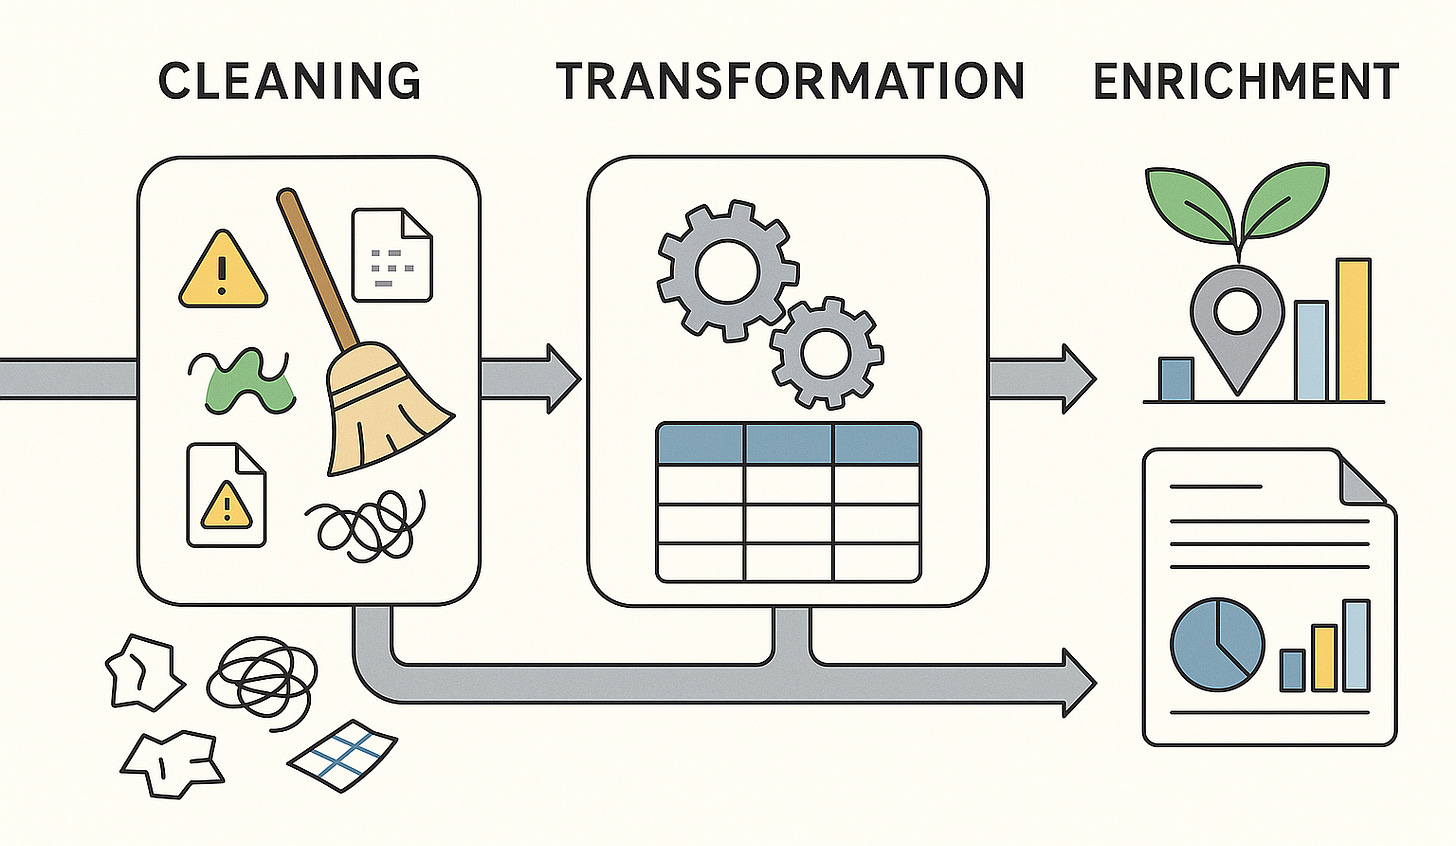
Now, let’s talk modes of processing:
Batch Processing is your classic “load it all up and crunch it” style—great for nightly ETL jobs, monthly reports, or processing historical logs. Tools like Apache Spark, AWS Glue, or even Pandas in Python are popular choices here.
Stream Processing is more like a live concert—data flows in real-time and needs to be processed on the fly. Think fraud detection, live metrics dashboards, or recommendation engines. Here you’ll want Apache Flink, Kafka Streams, or Google Dataflow.
One more thing—data processing jobs should be idempotent. That’s a fancy way of saying: if something fails halfway and you rerun it, the results should be the same, not duplicated or corrupted. Trust me, future-you will thank past-you for this one.
And don’t forget about format optimization. Writing processed data to formats like Parquet or Avro, with proper partitioning (by date, region, etc.), can seriously boost downstream performance.
So, in summary: data processing is the stage where raw data is transformed into something that analysts, scientists, and dashboards can actually use. It’s about getting the data clean, shaped, and enriched—ready to drive decisions or feed ML models.
Up next? Let’s talk about Data Orchestration—because none of this matters if the whole workflow breaks silently at 2 AM.
4. Data Orchestration: The Maestro of Your Data Symphony
Imagine your data workflow as an orchestra. You’ve got violins (data ingestion), cellos (storage), trumpets (processing), and drums (analytics)—all essential, but if they start playing at the wrong time or in the wrong order? Chaos. That’s why you need a conductor—and that’s what data orchestration is.
At its core, data orchestration is about coordinating, scheduling, and managing all your data tasks—making sure everything runs in the correct sequence, with the right dependencies, and doesn’t silently fail without you knowing.
Scheduling: You define when each job should run. Maybe your ingestion runs every hour, your processing kicks off five minutes later, and your dashboards refresh nightly.
Dependency Management: Orchestration tools track which jobs depend on which. If the raw data isn’t ingested successfully, the processing stage won’t start. No more broken pipelines producing half-baked reports.
Monitoring & Alerting: One of the best parts of orchestration? Visibility. Tools like Apache Airflow, Prefect, or Dagster let you visualize task runs, check logs, retry failures, and even get Slack alerts if something goes wrong.
Let’s break down a classic example. You have a workflow that:
Ingests sales data from an API.
Stores it in a cloud warehouse like BigQuery.
Cleans and transforms the data using a Spark job.
Updates a dashboard in Looker.
With proper orchestration, these steps are stitched together into a DAG—a Directed Acyclic Graph. This graph ensures each task executes only after its upstream dependencies succeed.
And here’s where things get exciting: modern orchestration tools also support parameterization, dynamic task generation, and version control via code-as-config (like Python or YAML). This means you can templatize workflows and adapt to changes without rewriting the whole thing.
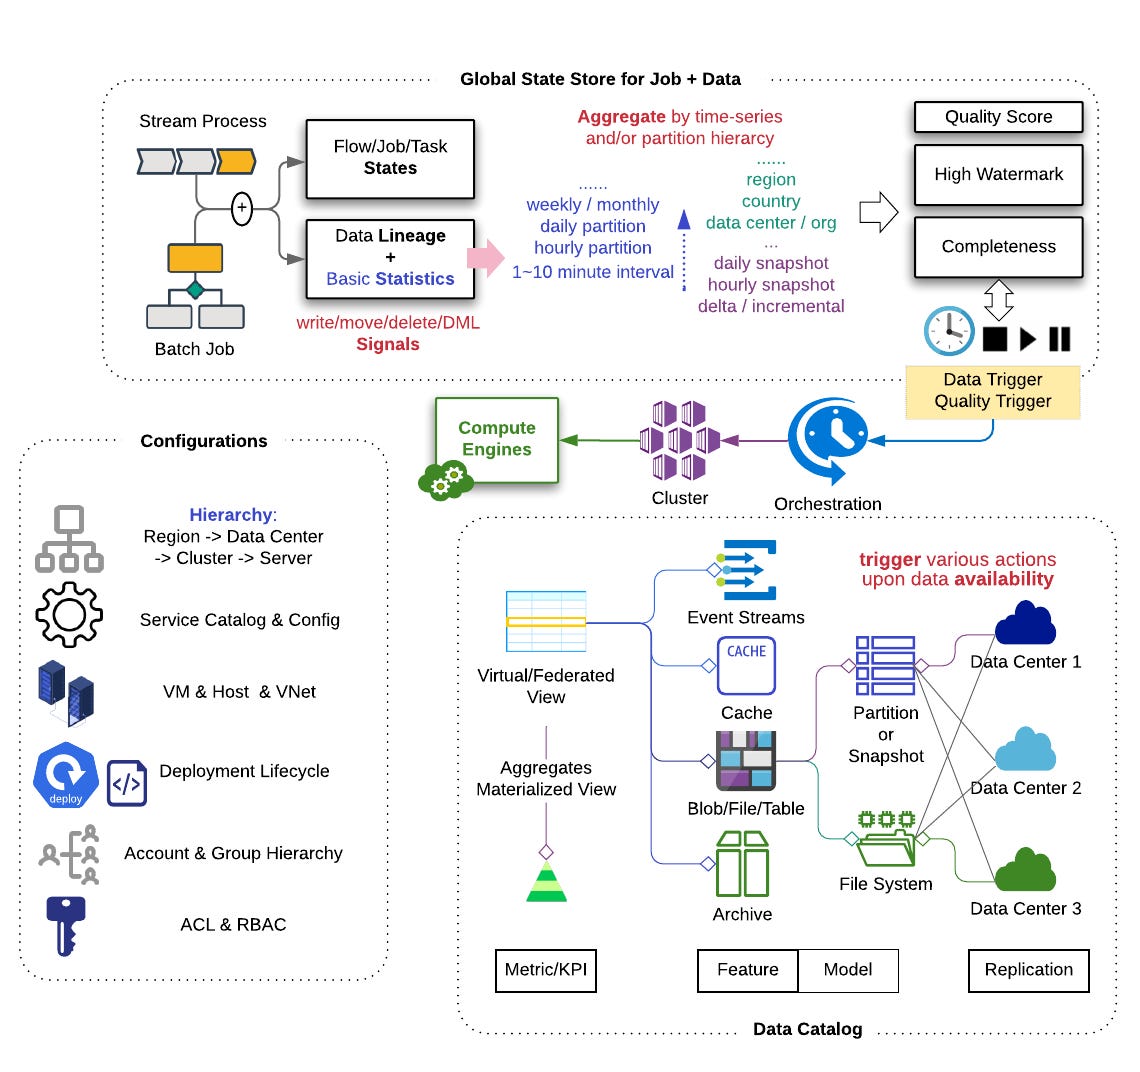
Bonus: Some platforms integrate orchestration with CI/CD pipelines, enabling automated testing and deployment of data workflows—yes, just like in software engineering. That’s the DataOps mindset in action.
In essence, data orchestration is the backbone that keeps your data pipelines dependable, scalable, and sane. It’s what ensures the right data is available at the right time, every time.
Coming up next: even the best-orchestrated pipelines are useless if the data itself can’t be trusted. Let’s dive into Data Quality and Validation.
5. Data Quality and Validation: Trust, but Verify
You’ve built the pipelines, set up storage, and even automated workflows like a pro. But here’s a crucial question—can you trust your data?
In the world of data engineering, data quality isn’t a luxury; it’s a necessity. Poor-quality data can lead to faulty analyses, misguided business decisions, and a loss of trust across the organization. That’s why data validation—the process of checking data against predefined rules and expectations—is woven into every robust pipeline.
What are we validating?
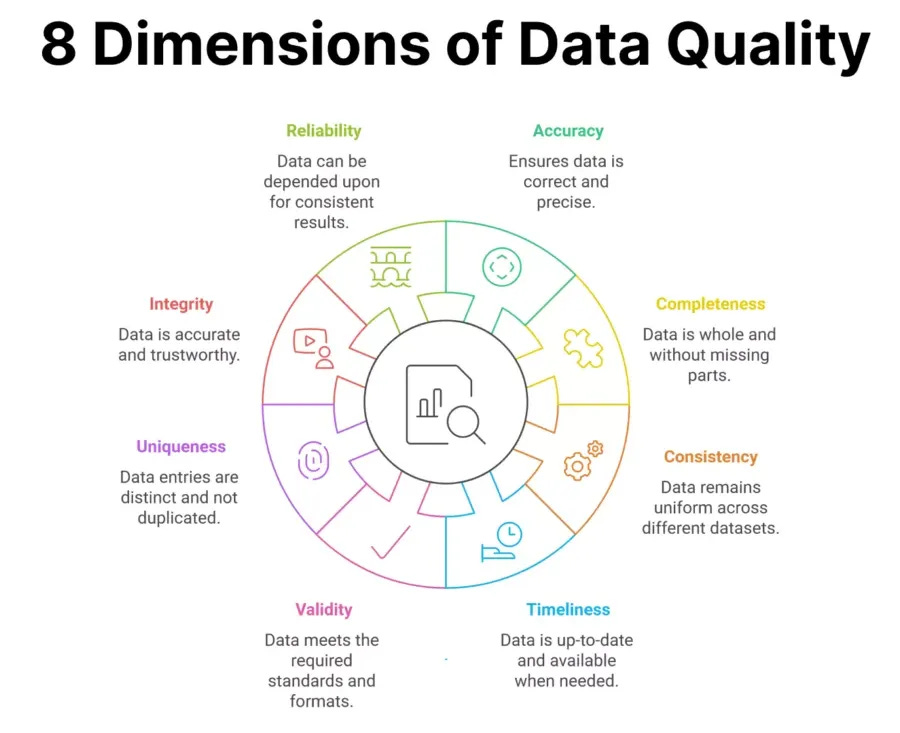
Completeness: Are there missing values where there shouldn’t be? Did every expected column or record show up?
Consistency: Is the format or unit of measurement consistent? For instance, do all timestamps follow ISO 8601?
Uniqueness: Are there duplicate rows or keys that should be unique?
Accuracy: Does the data match external or historical sources?
Timeliness: Is the data fresh, or are you analyzing stale entries?
These checks are not just about finding mistakes—they’re about catching them before they cascade into bigger problems.
How do we validate?
That’s where data validation tools shine. Tools like:
Great Expectations: Allows you to define and document “expectations”—for example, “The
agecolumn should never be null, and its values must be between 0 and 120.”Deequ (by Amazon): A Scala-based library for large-scale data validation on Spark datasets.
Pandera (Python): Integrates seamlessly with pandas DataFrames to validate schema and data integrity.
These tools can integrate directly into your workflows—either as part of the processing job or as standalone validation stages—and even generate automated documentation and alerts when anomalies are found.
Why does this matter?
Because without data quality checks:
Machine learning models are trained on flawed inputs.
Dashboards display misleading metrics.
Executives make decisions on broken data.
And fixing problems after the fact is always more expensive than catching them early.
So, think of validation as your data’s safety net—a proactive, programmable way to say, “I trust this pipeline because I know the data meets our standards.”
Next up: now that we’ve ensured the data is clean and validated, it’s time to shape it for optimal analysis. Let’s explore the world of Data Modeling in the next section.
6. Data Modeling: Structuring Data for Deep Insights
Now that we’ve cleaned and validated our data, it’s time to structure it in a way that makes it easy to analyze and interpret. This is where data modeling comes into play. Think of data modeling as the blueprint for your data architecture—it defines how data should be organized, stored, and related to each other in a way that optimizes query performance and analytic capabilities.
What is Data Modeling?
Data modeling is the process of designing the structure of a database or data system. It involves defining how data points relate to one another and determining the best way to organize and store data. A well-constructed data model ensures that data is organized logically and efficiently, making it easy to perform queries, generate reports, and build analytical applications.
Types of Data Models
Depending on your needs, there are several approaches to data modeling. Let’s explore the three most common types:
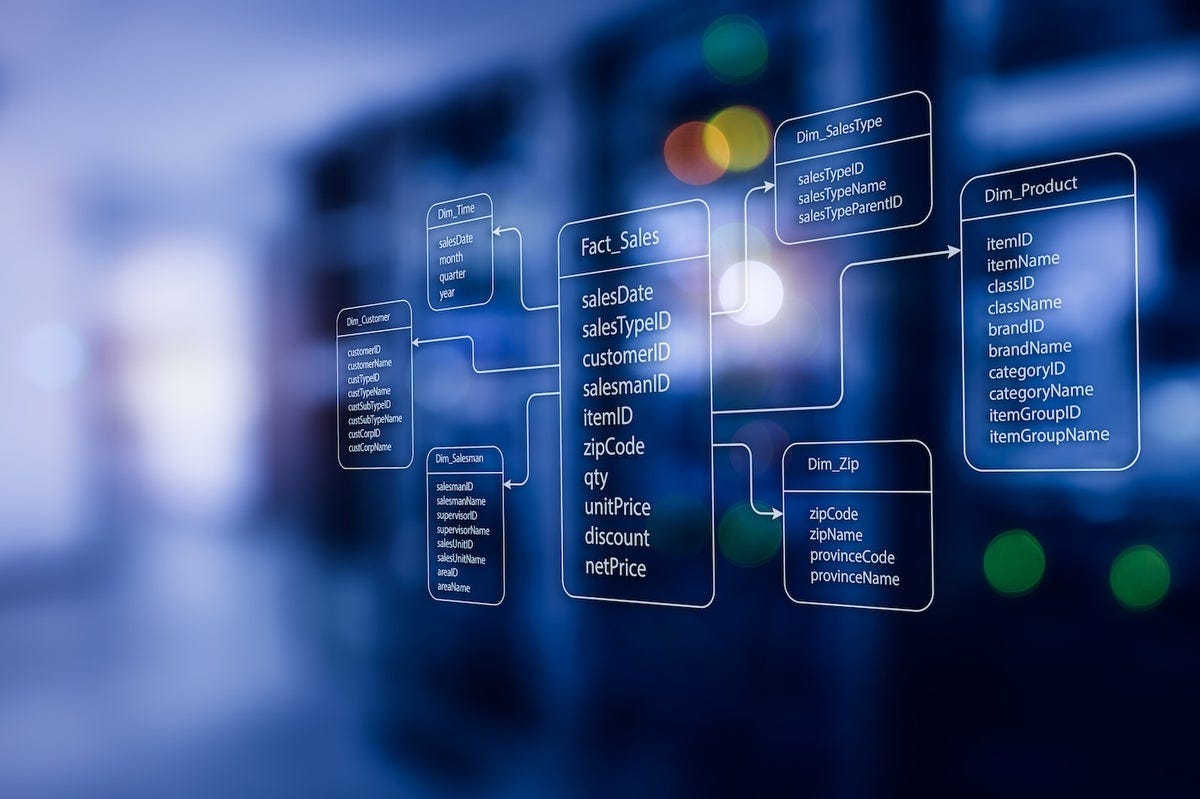
Star Schema: This model is widely used in data warehousing. The star schema consists of a central fact table (which stores transactional data) surrounded by dimension tables (which store descriptive attributes). This structure simplifies queries by reducing the number of joins needed, making it ideal for business intelligence (BI) reporting.
Example: A sales database might have a central fact table containing sales transactions and dimension tables for products, customers, and time.
Snowflake Schema: An extension of the star schema, the snowflake schema normalizes dimension tables to eliminate data redundancy. While it offers more efficient storage, it can increase the complexity of queries.
Example: In the snowflake model, the product dimension could be split into product category and product details, further breaking down data into smaller, more manageable pieces.
Data Vault Modeling: This approach is designed for scalability and agility. It focuses on modeling the business’s core processes, rather than predefined reporting structures, making it ideal for organizations that expect their data landscape to evolve over time.
Example: The Data Vault model would structure data around hubs (business keys), links (relationships between entities), and satellites (contextual information), allowing for more flexible reporting and data integration.
Why Does Data Modeling Matter?
Without a proper data model, your database could become a chaotic tangle of disconnected tables, slow queries, and data integrity issues. The structure of your data directly affects how efficiently your system performs and how easily you can extract meaningful insights.
A solid data model:
Optimizes Query Performance: Well-structured data means quicker, more efficient queries.
Ensures Data Consistency: By defining relationships between data points, you ensure that data is consistent and accurate.
Simplifies Data Analysis: A well-organized database makes it easier for analysts and data scientists to work with the data and derive valuable insights.
Just like organizing your room into tidy sections helps you find things quickly, data modeling organizes your datasets so your team can navigate them with ease.
Data Modeling Tools
To make this process smoother, there are various tools and frameworks that assist with creating and maintaining data models. Some popular ones include:
dbt (Data Build Tool): Helps analysts and engineers transform raw data into analysis-ready datasets through version-controlled SQL models.
ER/Studio: A comprehensive data modeling tool that helps you design and visualize database structures.
PowerDesigner: A tool for both logical and physical data modeling that integrates well with database systems like SQL Server and Oracle.
Now that we’ve structured our data, it's time to make sense of it. The next step on our journey takes us to Data Analytics and Visualization, where we’ll learn how to turn our structured data into powerful insights.
7. Data Analytics and Visualization: Deriving Insights
With clean, well-structured data in place, the fun begins: transforming that data into actionable insights. This is the phase where data really starts to tell its story. By performing in-depth analysis and creating meaningful visualizations, we can uncover patterns, trends, and relationships that drive decision-making.
What is Data Analytics?
Data analytics is the process of examining data to draw conclusions about the information it contains. This can involve a range of techniques, from simple descriptive statistics to complex predictive models. The goal is to extract useful insights that can inform business strategy, operational improvements, or scientific discoveries.
There are several types of data analytics, including:
Descriptive Analytics: This answers the question, “What happened?” It involves summarizing historical data to understand trends and patterns.
Diagnostic Analytics: This answers, “Why did it happen?” It digs deeper to identify the causes behind trends or anomalies.
Predictive Analytics: This answers, “What will happen next?” It uses statistical models and machine learning to forecast future events.
Prescriptive Analytics: This answers, “What should we do about it?” It provides recommendations for actions based on the data insights.
The Role of Data Visualization
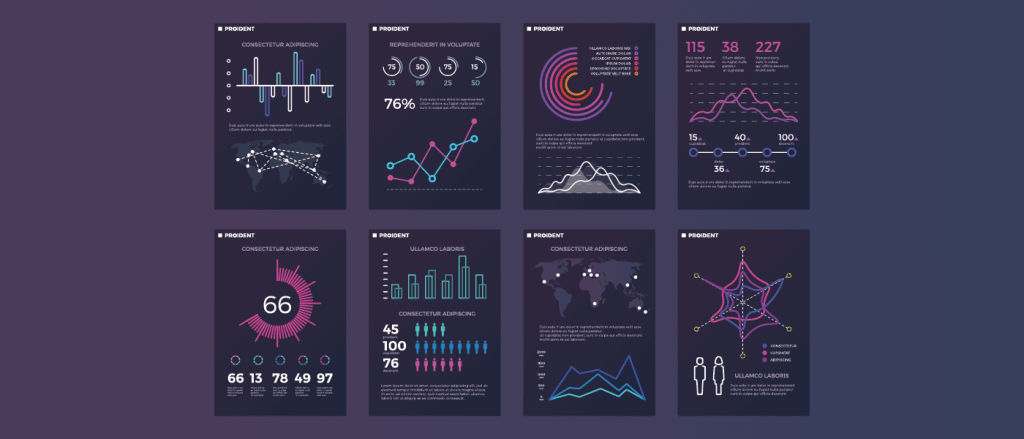
As the saying goes, “A picture is worth a thousand words.” In data analytics, this rings especially true. Data visualization is the graphical representation of information and data. By converting data into charts, graphs, and dashboards, we make it easier for stakeholders to understand complex datasets and trends.
Types of Data Visualizations
Effective visualizations can turn raw numbers into intuitive insights. Some common types include:
Bar and Line Charts: These are great for showing comparisons over time or across categories.
Pie Charts: Useful for showing proportional data or percentage breakdowns.
Heat Maps: These display the magnitude of values with color variations, often used to show correlation matrices or geographic distributions.
Dashboards: Interactive collections of data visualizations that allow users to explore key metrics in real-time.
Exploratory Data Analysis (EDA)
Before jumping into complex analysis or predictive modeling, it’s essential to understand the data. This is where Exploratory Data Analysis (EDA) comes in. EDA is the process of analyzing data sets to summarize their main characteristics, often with visual methods.
During EDA, data scientists typically look for:
Outliers: Points that deviate significantly from the rest of the data.
Correlations: Identifying relationships between variables.
Distributions: Understanding how data is spread (e.g., normal distribution vs. skewed data).
By visualizing and analyzing these patterns, we can uncover hidden insights that guide further analysis or model-building efforts.
Tools for Data Analytics and Visualization
To perform these analyses and create stunning visualizations, there are a variety of tools available:
Python Libraries: Libraries like pandas, numpy, and matplotlib are essential for data analysis, while seaborn and plotly provide advanced data visualization capabilities.
Tableau: One of the leading data visualization tools, known for its ease of use and powerful dashboarding features.
Power BI: A Microsoft product that integrates well with Excel and other Microsoft tools, making it a popular choice for business intelligence reporting.
Looker: A data analytics and business intelligence platform that helps organizations explore and visualize data in real time.
How Does Analytics and Visualization Drive Business Value?
The true value of data analytics and visualization comes from its ability to inform business decisions. For instance:
Market Segmentation: By analyzing customer data, businesses can identify distinct customer segments and tailor their marketing strategies accordingly.
Predictive Maintenance: In manufacturing, predictive analytics can forecast when equipment will fail, allowing companies to perform maintenance before problems arise, reducing downtime and repair costs.
Financial Forecasting: By analyzing historical financial data, businesses can predict future revenues, expenses, and investments, allowing them to make more informed budgeting decisions.
Data visualization is critical in helping stakeholders at all levels of an organization see the story behind the numbers. A well-designed dashboard can quickly communicate key insights, allowing business leaders to make swift, data-driven decisions.
With the data analyzed and visualized, we now have a clear understanding of what the data is telling us. But before we move forward, we must consider how to ensure the data remains trustworthy and secure. The next step on our journey will cover Data Governance and Security, ensuring that our insights are not only accurate but also compliant and protected.
8. Data Governance and Security: Managing Data Responsibly
As organizations increasingly rely on data to drive business decisions, ensuring that data is handled responsibly, ethically, and securely becomes more critical than ever. Data governance and security go hand in hand, ensuring that data is not only accurate but also protected from misuse or breaches.
What is Data Governance?
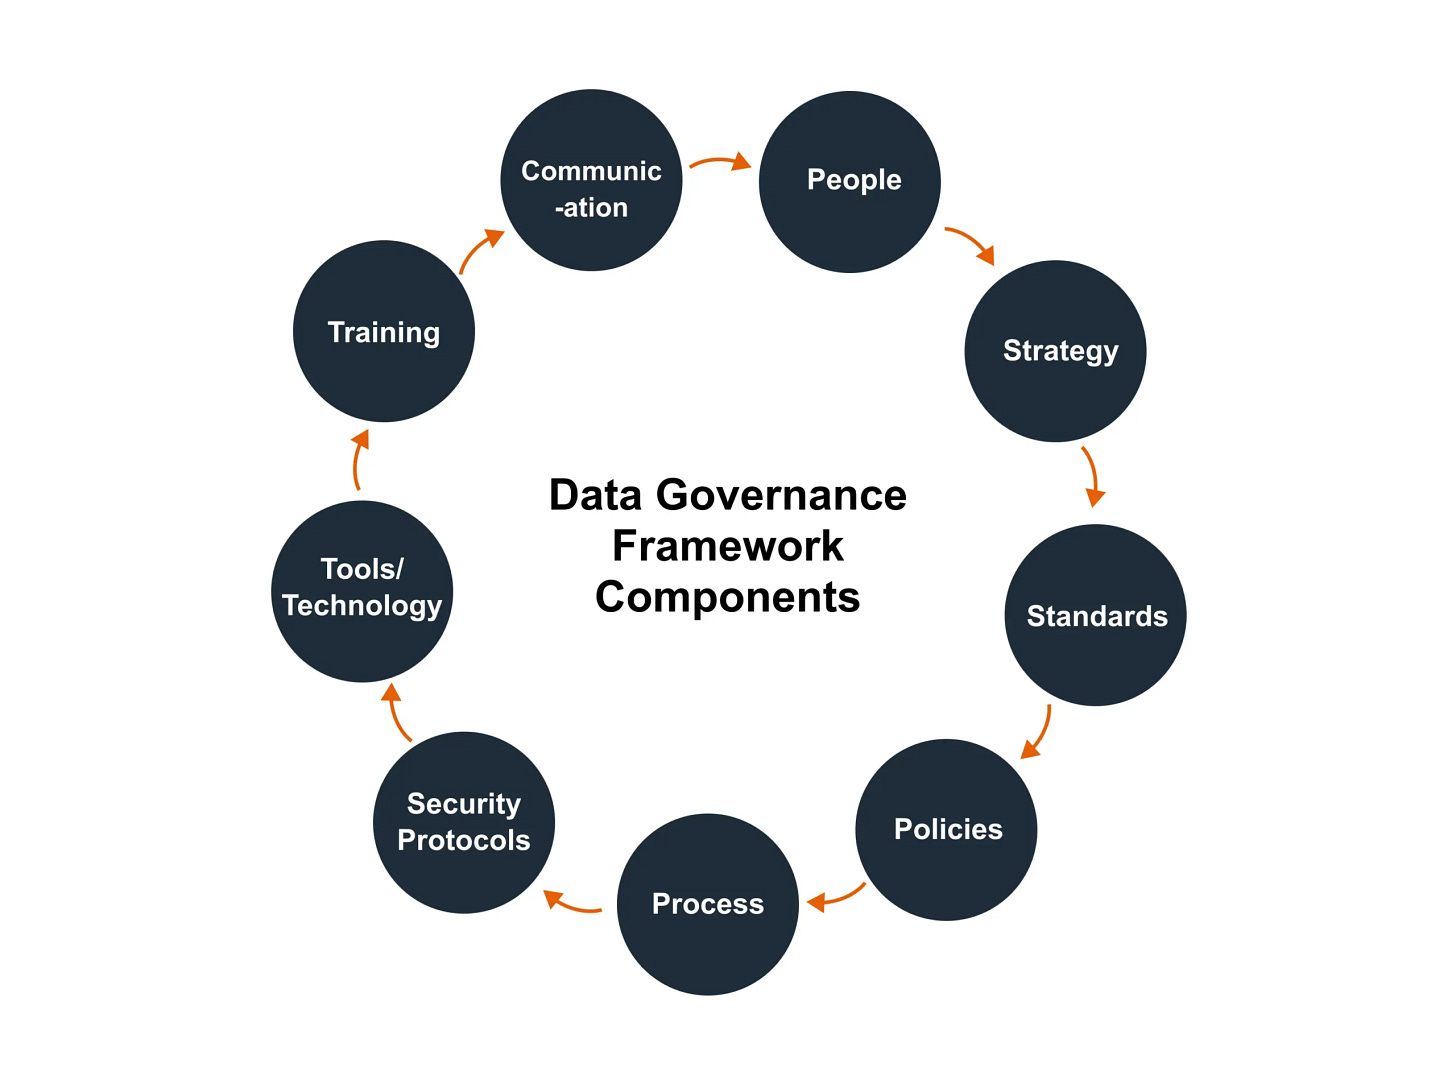
Data governance refers to the policies, standards, and practices that ensure data is effectively managed across its lifecycle. It ensures that data is accessible, accurate, consistent, and used responsibly across an organization. Think of it as the framework that keeps everything in check, from who can access the data to how it's stored and utilized.
Some key components of data governance include:
Data Ownership and Stewardship: Clear definition of who owns the data and who is responsible for its quality and integrity.
Data Quality Management: Ensuring that data is accurate, consistent, and up-to-date, as we discussed in earlier stages.
Data Lineage: Understanding and tracking the flow of data through systems, from its source to its final use, ensuring transparency and accountability.
Metadata Management: Organizing and managing metadata (data about data) to ensure it’s searchable, accessible, and understandable.
Without strong governance, even the most powerful data pipelines and models can fail. Poorly managed data can lead to inconsistencies, errors, or even privacy violations, which can severely damage trust and business outcomes.
The Importance of Data Security
As data continues to grow in importance, so do the risks associated with it. Protecting data from unauthorized access, tampering, or loss is paramount for both regulatory compliance and organizational integrity. Data security involves implementing measures to prevent data breaches, hacking, and other malicious activities that can compromise sensitive information.
Some essential aspects of data security include:
Access Control: Ensuring that only authorized individuals can access or modify specific data. This can involve role-based access control (RBAC), multi-factor authentication (MFA), and other mechanisms to limit exposure.
Encryption: Protecting data both at rest (stored data) and in transit (data being transmitted) through encryption methods such as AES (Advanced Encryption Standard) or TLS (Transport Layer Security).
Data Masking and Anonymization: When working with sensitive or personally identifiable information (PII), data can be masked or anonymized to protect privacy while still enabling useful analysis.
Data security is not just about protecting data from external threats, but also ensuring internal stakeholders follow the proper protocols. Even the most sophisticated security measures can be compromised by human error or negligence, which is why creating a strong culture of data security is vital.
Regulatory Compliance and Legal Considerations
In addition to organizational policies, data governance must also align with legal and regulatory requirements. Regulations like GDPR (General Data Protection Regulation) in the EU, CCPA (California Consumer Privacy Act) in California, and HIPAA (Health Insurance Portability and Accountability Act) in the U.S. set guidelines on how data should be handled, stored, and processed, especially personal and sensitive data.
Non-compliance with these regulations can lead to hefty fines, legal battles, and reputational damage. Therefore, organizations need to embed compliance into their data governance practices, ensuring data collection, storage, and usage are done within the legal frameworks.
Data Auditing and Monitoring
To ensure compliance and security, data auditing plays a crucial role. This involves regularly reviewing and auditing the data access logs to ensure that only authorized users are accessing or modifying sensitive data. Monitoring systems help in detecting potential security threats in real-time, whether they come from external hackers or internal malpractices.
Data Lineage and Data Audit Trails are useful in this regard. By maintaining a record of where data originates, how it flows through systems, and how it is transformed, organizations can better track any unauthorized or suspicious activity.
Roles and Responsibilities in Data Governance
Effective data governance requires the involvement of various stakeholders across the organization. These roles include:
Data Stewards: Responsible for maintaining the quality and consistency of data within specific domains or departments.
Data Governance Managers: Oversee the entire governance framework, ensuring policies are followed and the data is secure.
Security Officers: Focus on implementing and enforcing security measures, ensuring compliance with privacy regulations and data protection laws.
Strong governance and security practices empower organizations to trust their data and use it with confidence, enabling better decision-making and innovation.
As we move to the final section of our journey, it's important to remember that ensuring the quality, security, and integrity of data doesn’t stop here. With the increasing complexity and velocity of data, we must embrace modern practices like DataOps, which streamline the entire process. Let's dive into DataOps next to explore how this emerging field is optimizing the data lifecycle.
9. DataOps: Streamlining Data Operations
In the fast-paced world of data engineering, speed and efficiency are paramount. As data pipelines grow increasingly complex, traditional methods of handling and processing data may struggle to keep up. This is where DataOps (Data Operations) comes into play—an evolving discipline that applies agile methodologies to data management. By aligning data operations with development and operations, DataOps ensures that data workflows are not only faster but also more reliable and scalable.
What is DataOps?
DataOps is a set of practices, processes, and tools designed to streamline the development, deployment, and operation of data pipelines. It applies principles from DevOps, a framework focused on continuous integration (CI) and continuous deployment (CD) in software development, to the world of data engineering. Essentially, DataOps ensures that data flows smoothly through the pipeline from ingestion to analysis, supporting agile decision-making and iterative development.
The goal of DataOps is to foster collaboration between cross-functional teams—data engineers, data scientists, analysts, and IT operations—while ensuring that data pipelines remain automated, reliable, and scalable. Just as DevOps has revolutionized the way we handle software, DataOps aims to revolutionize how data is managed and delivered.
Core Principles of DataOps
DataOps focuses on automation, collaboration, and continuous delivery. Some key principles include:
Automation: Automating repetitive tasks in the data pipeline, such as data collection, cleaning, transformation, and validation, to reduce manual intervention and human error. This leads to faster data delivery and improved quality.
Continuous Integration and Continuous Delivery (CI/CD): In DataOps, this means continuously testing, integrating, and deploying data workflows to ensure that any changes (like schema changes or data model updates) are seamlessly incorporated into the pipeline with minimal disruption.
Collaboration: Fostering close cooperation between data engineers, data scientists, business teams, and IT operations. When everyone has a unified view of the data and the pipeline, it reduces friction and speeds up the delivery of valuable insights.
Monitoring and Feedback: Constant monitoring of data pipelines and real-time feedback loops allow for the quick identification of problems or bottlenecks. This means potential issues are caught early, reducing downtime and improving data flow reliability.
Data Quality: DataOps emphasizes the importance of high-quality data. It integrates data quality checks directly into the pipeline, ensuring that only accurate, clean data moves through the system.
DataOps Tools
To implement DataOps effectively, organizations rely on a range of tools and platforms. These tools help automate data pipeline management, provide version control, facilitate collaboration, and ensure smooth deployment. Some popular tools include:
Apache Airflow: A widely-used tool for orchestrating complex data workflows. It helps manage task dependencies, schedule processes, and monitor pipeline execution.
Dagster: A newer tool for orchestrating and managing data workflows. It offers a more modern approach to pipeline management, with a strong emphasis on reliability and scalability.
Prefect: Another orchestration tool that focuses on workflow automation and monitoring. It is known for its simplicity and integration with cloud platforms.
DBT (Data Build Tool): Specifically designed for transforming data within the data warehouse, DBT enables easy version control, testing, and scheduling of data models.
GitLab and GitHub: Source control platforms that allow teams to version, test, and collaborate on data pipeline code, much like how DevOps teams use them for software development.
By leveraging these tools, DataOps enables data teams to improve collaboration, maintain high-quality data, and accelerate the delivery of insights.
The Benefits of DataOps
The primary benefits of implementing DataOps are related to increased speed, improved data quality, and better collaboration. Specifically:
Faster Time to Insight: With automated data pipelines and continuous delivery, the time it takes to turn raw data into actionable insights is reduced. Businesses can make more timely, data-driven decisions.
Scalability: DataOps allows data pipelines to scale with the growing volume and complexity of data. This ensures that as data sources increase, the infrastructure can handle the additional load seamlessly.
Improved Collaboration: By breaking down silos between different teams (e.g., data engineers, analysts, and business users), DataOps fosters a culture of collaboration, resulting in better-aligned data projects and a clearer understanding of data goals.
Higher Data Quality: DataOps ensures that data quality checks are integrated into the pipeline itself, reducing the risk of faulty or inconsistent data being used for decision-making.
Increased Reliability: Continuous testing, monitoring, and version control help ensure that data workflows remain operational, even as changes are made to the pipeline.

The Future of DataOps
As data continues to grow in volume, variety, and velocity, the need for agile, scalable data management practices will only increase. DataOps represents the future of data engineering, enabling organizations to stay ahead of the curve. By embracing automation, collaboration, and continuous improvement, businesses can maintain high-quality data pipelines that deliver consistent insights at scale.
The evolution of DataOps aligns closely with broader trends in cloud computing, machine learning, and real-time analytics. As organizations increasingly rely on data for competitive advantage, DataOps will become a key enabler of this transformation.
Conclusion
he journey from raw data to actionable insights is a complex process, but it’s one that’s essential to modern business success. By understanding each stage—data ingestion, storage, processing, orchestration, quality, modeling, and analytics—you can appreciate the importance of robust data engineering practices. Furthermore, by embracing Data Governance, Security, and DataOps, organizations can ensure that their data pipelines are reliable, secure, and scalable.
In the next installment of this series, we will dive deeper into the design and implementation of modern data pipelines. We'll explore the architecture, tools, and best practices that make a data pipeline efficient and effective for real-world use cases.
Until then, stay tuned and keep building!


